Dploy app for iPhone and iPad
Developer: Michael Hunt
First release : 20 Sep 2018
App size: 29.94 Mb
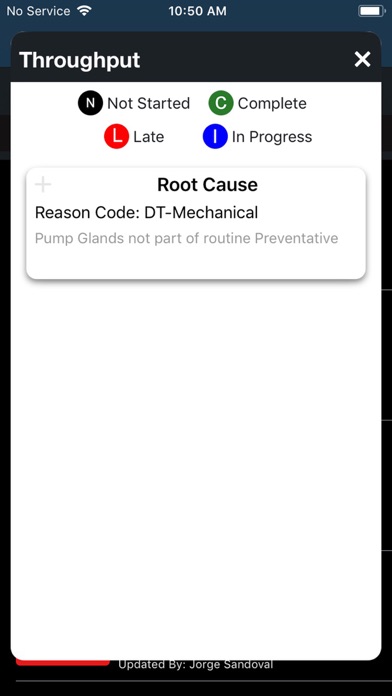
See what is happening in your business anytime, anywhere on your iPhone or iPad. View your business metrics in a graphical format and drill down to see more details behind the metrics like where an issue has occurred, when it happened and why it happened. You also have access to see what actions are in place to resolve the issues. Be alerted on escalated situations and see progress toward resolution. You can graphically visualize for a specified period of time, down to the day, the following information:
Planned metrics versus actual metrics
Reason codes behind missed targets
Actions and resources assigned to resolving issues
Review alerts that have been triggered and status of completion


